Part 2: Where does the Milky Way stand out best compared to the surrounding night sky?
DarkSky Oregon and volunteers support a network of Sky Quality Meters across the state which continuously record how bright and how dark is the night sky overhead. The data tell us which areas still have pristine night skies, which areas are polluted by artificial light, and which fall in-between. The data also tell us where the Milky Way shines in greatest contrast with the surrounding night sky. We call that an Index of Milky Way Visibility.
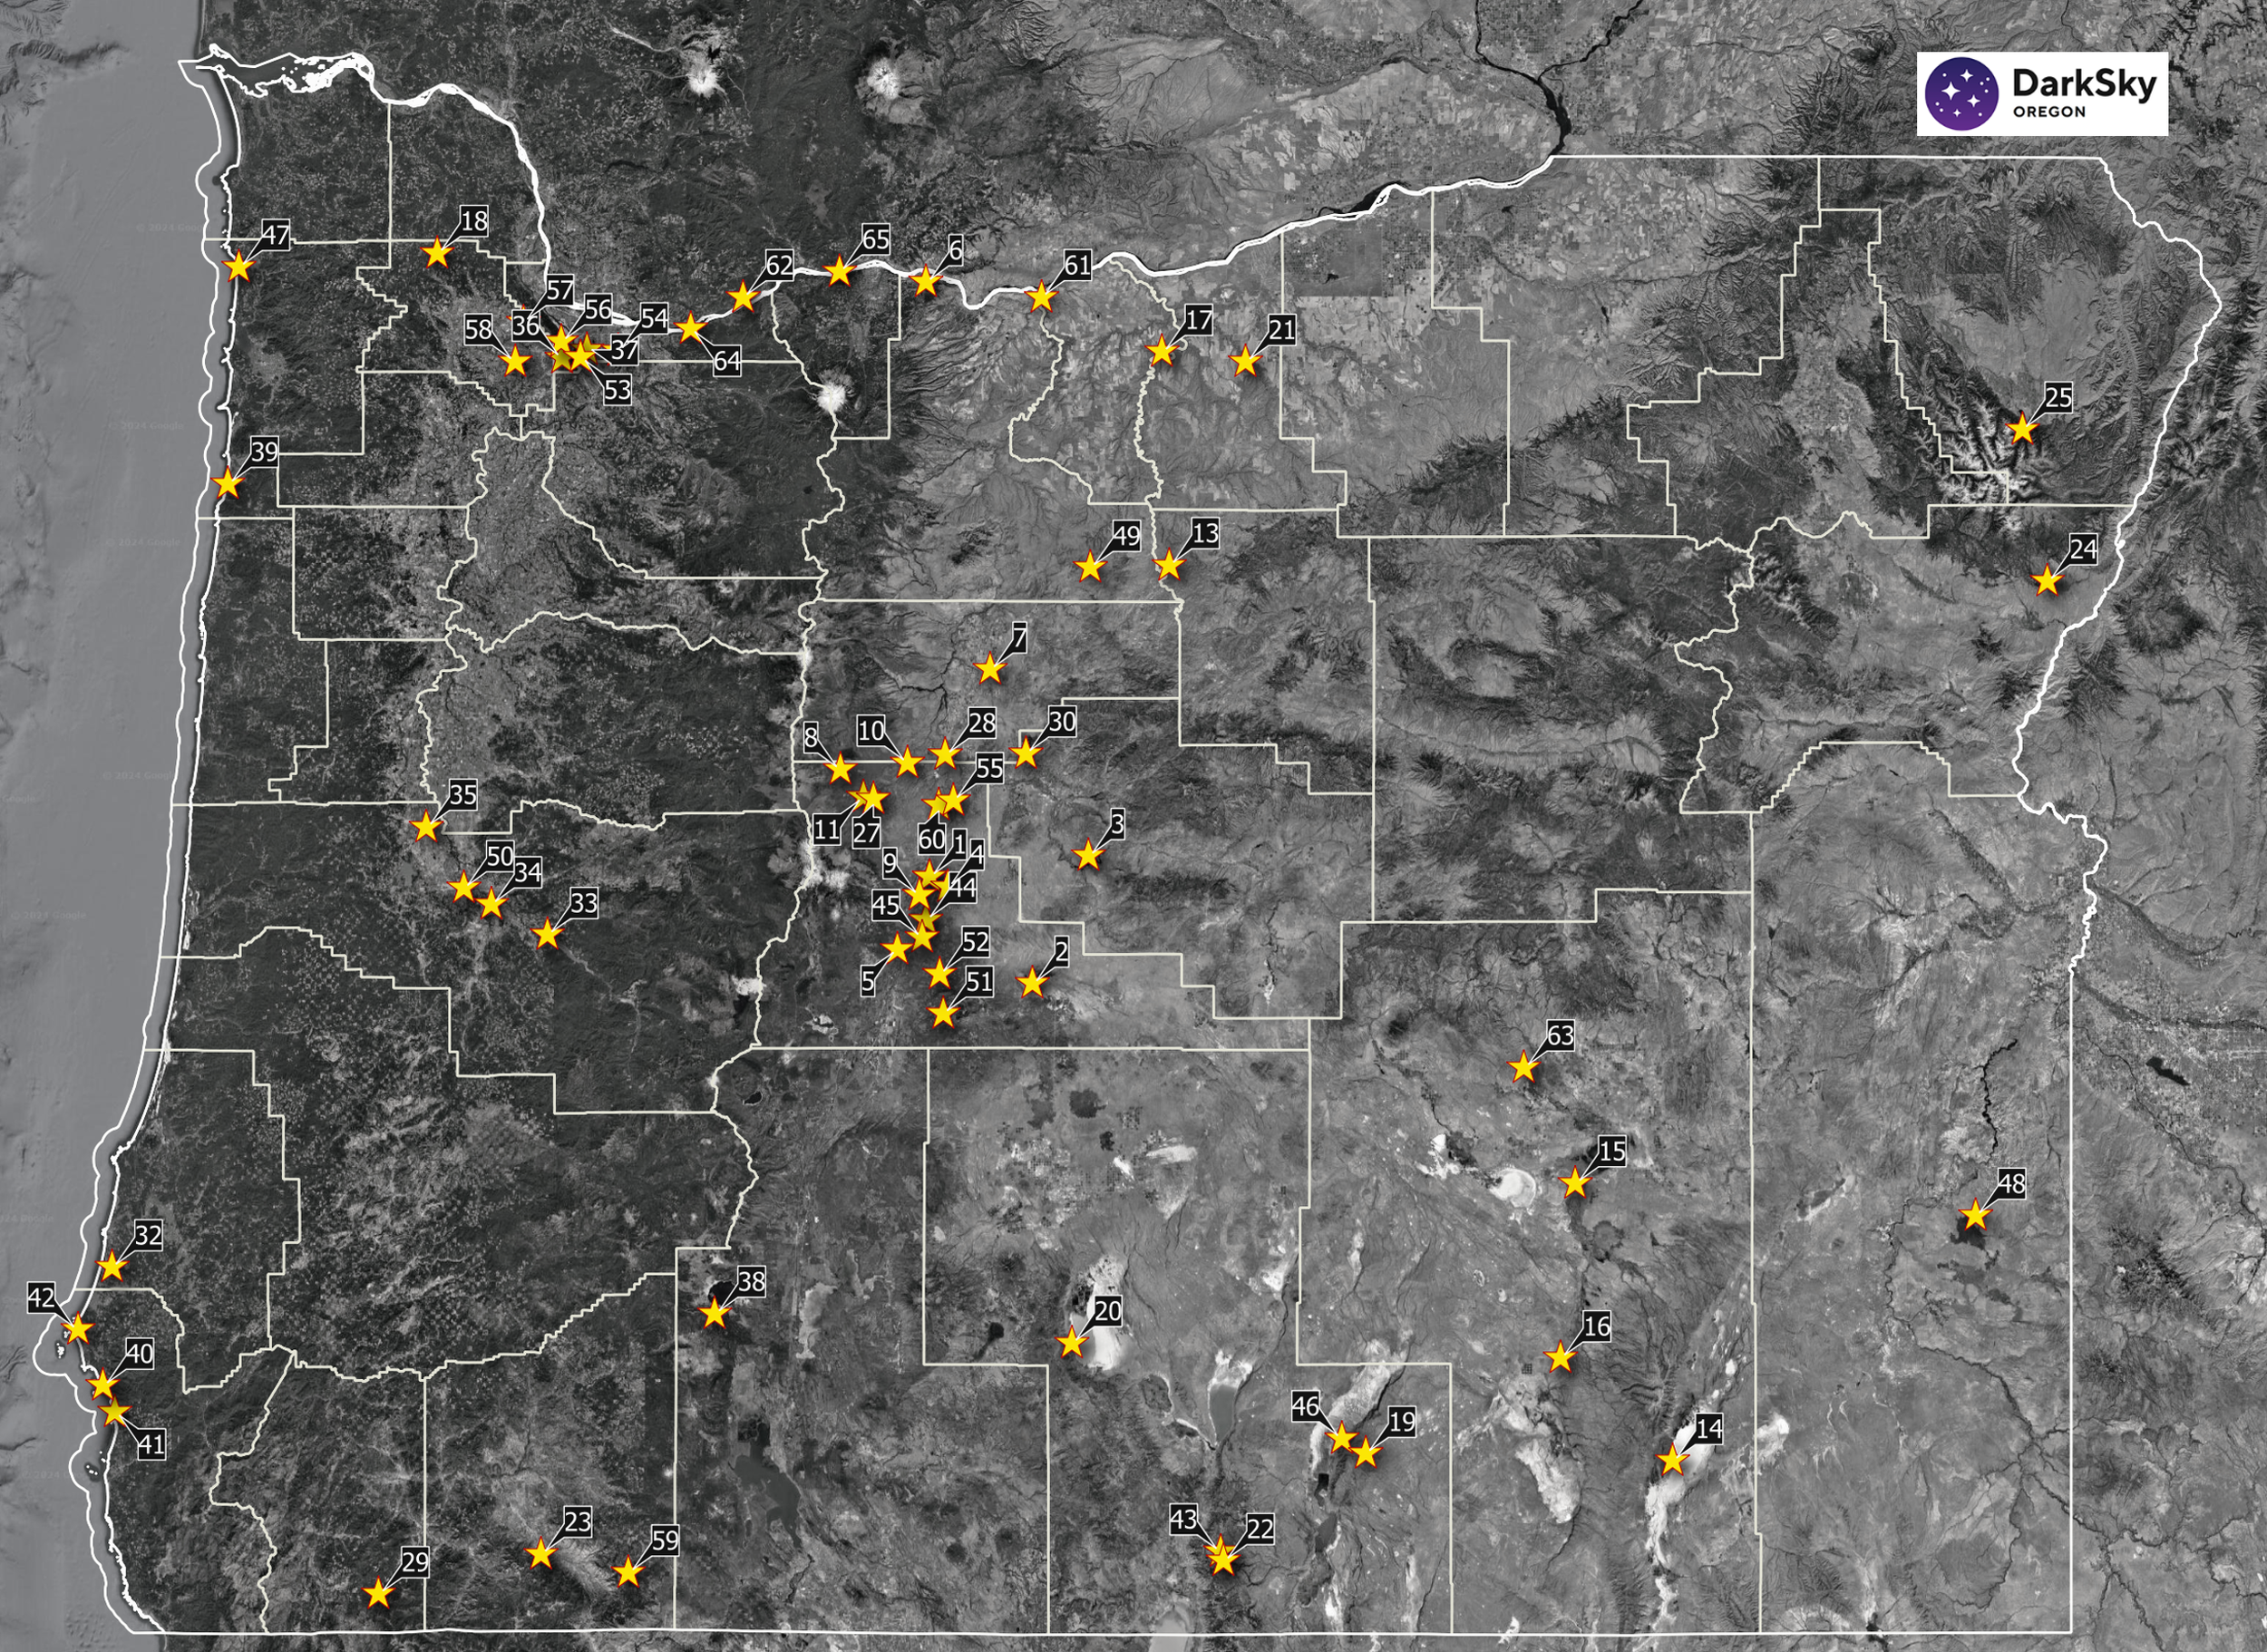
This map of Oregon shows the locations of our Sky Quality Meters. The size of the red star symbol tells how well the Milky Way stands out at each spot. The largest stars show the places where the Milky Way stands out best. The smallest star symbols shows where the Milky Way is generally not even visible -- over cities of Central Oregon, cities in the Willamette Valley and Portland.

The table below shows the data used to make the plot. The Milky Way is most visible at the sites near the bottom of the table, and is mostly not visible for sites at the top of the table.

We calculate the index both from the difference of logarithmic magnitudes/arc second squared data, and from a ratio of linear scale SQM flux data. Both are presented because different observers may prefer one over the other. The indices in each case are consistent, plot against each other in linear fashion (not shown) and each provides useful information.
The first data column in the table lists the difference of the median values at each site, for the night sky brightness when the Milky Way is seen by the SQM versus not. The units are magnitudes per arc second squared.
The second data column shows the same information but as a unitless ratio of linear flux data measured by the SQM. It can be interpreted by noting that, for example, the Milky Way at the Hart Mountain and Crater Lake sites is 1.3x brighter than the surrounding night sky. And at the two Portland sites, the Index value is about 1.0, which indicates that the Milky Way does not stand out in contrast to the surrounding night sky at all.
Support the effort to reduce light pollution.
Contact us at: hello@darkskyoregon.org
Key Results from the Oregon SQM Network: