Part 4: Where in Oregon are the clearest – least cloudy – night skies?
DarkSky Oregon and volunteers support a network of Sky Quality Meters across the state which continuously record how bright and how dark is the night sky overhead. The data also tell us which areas have the clearest night skies – the least cloudy – and which are most cloudy and in between too.
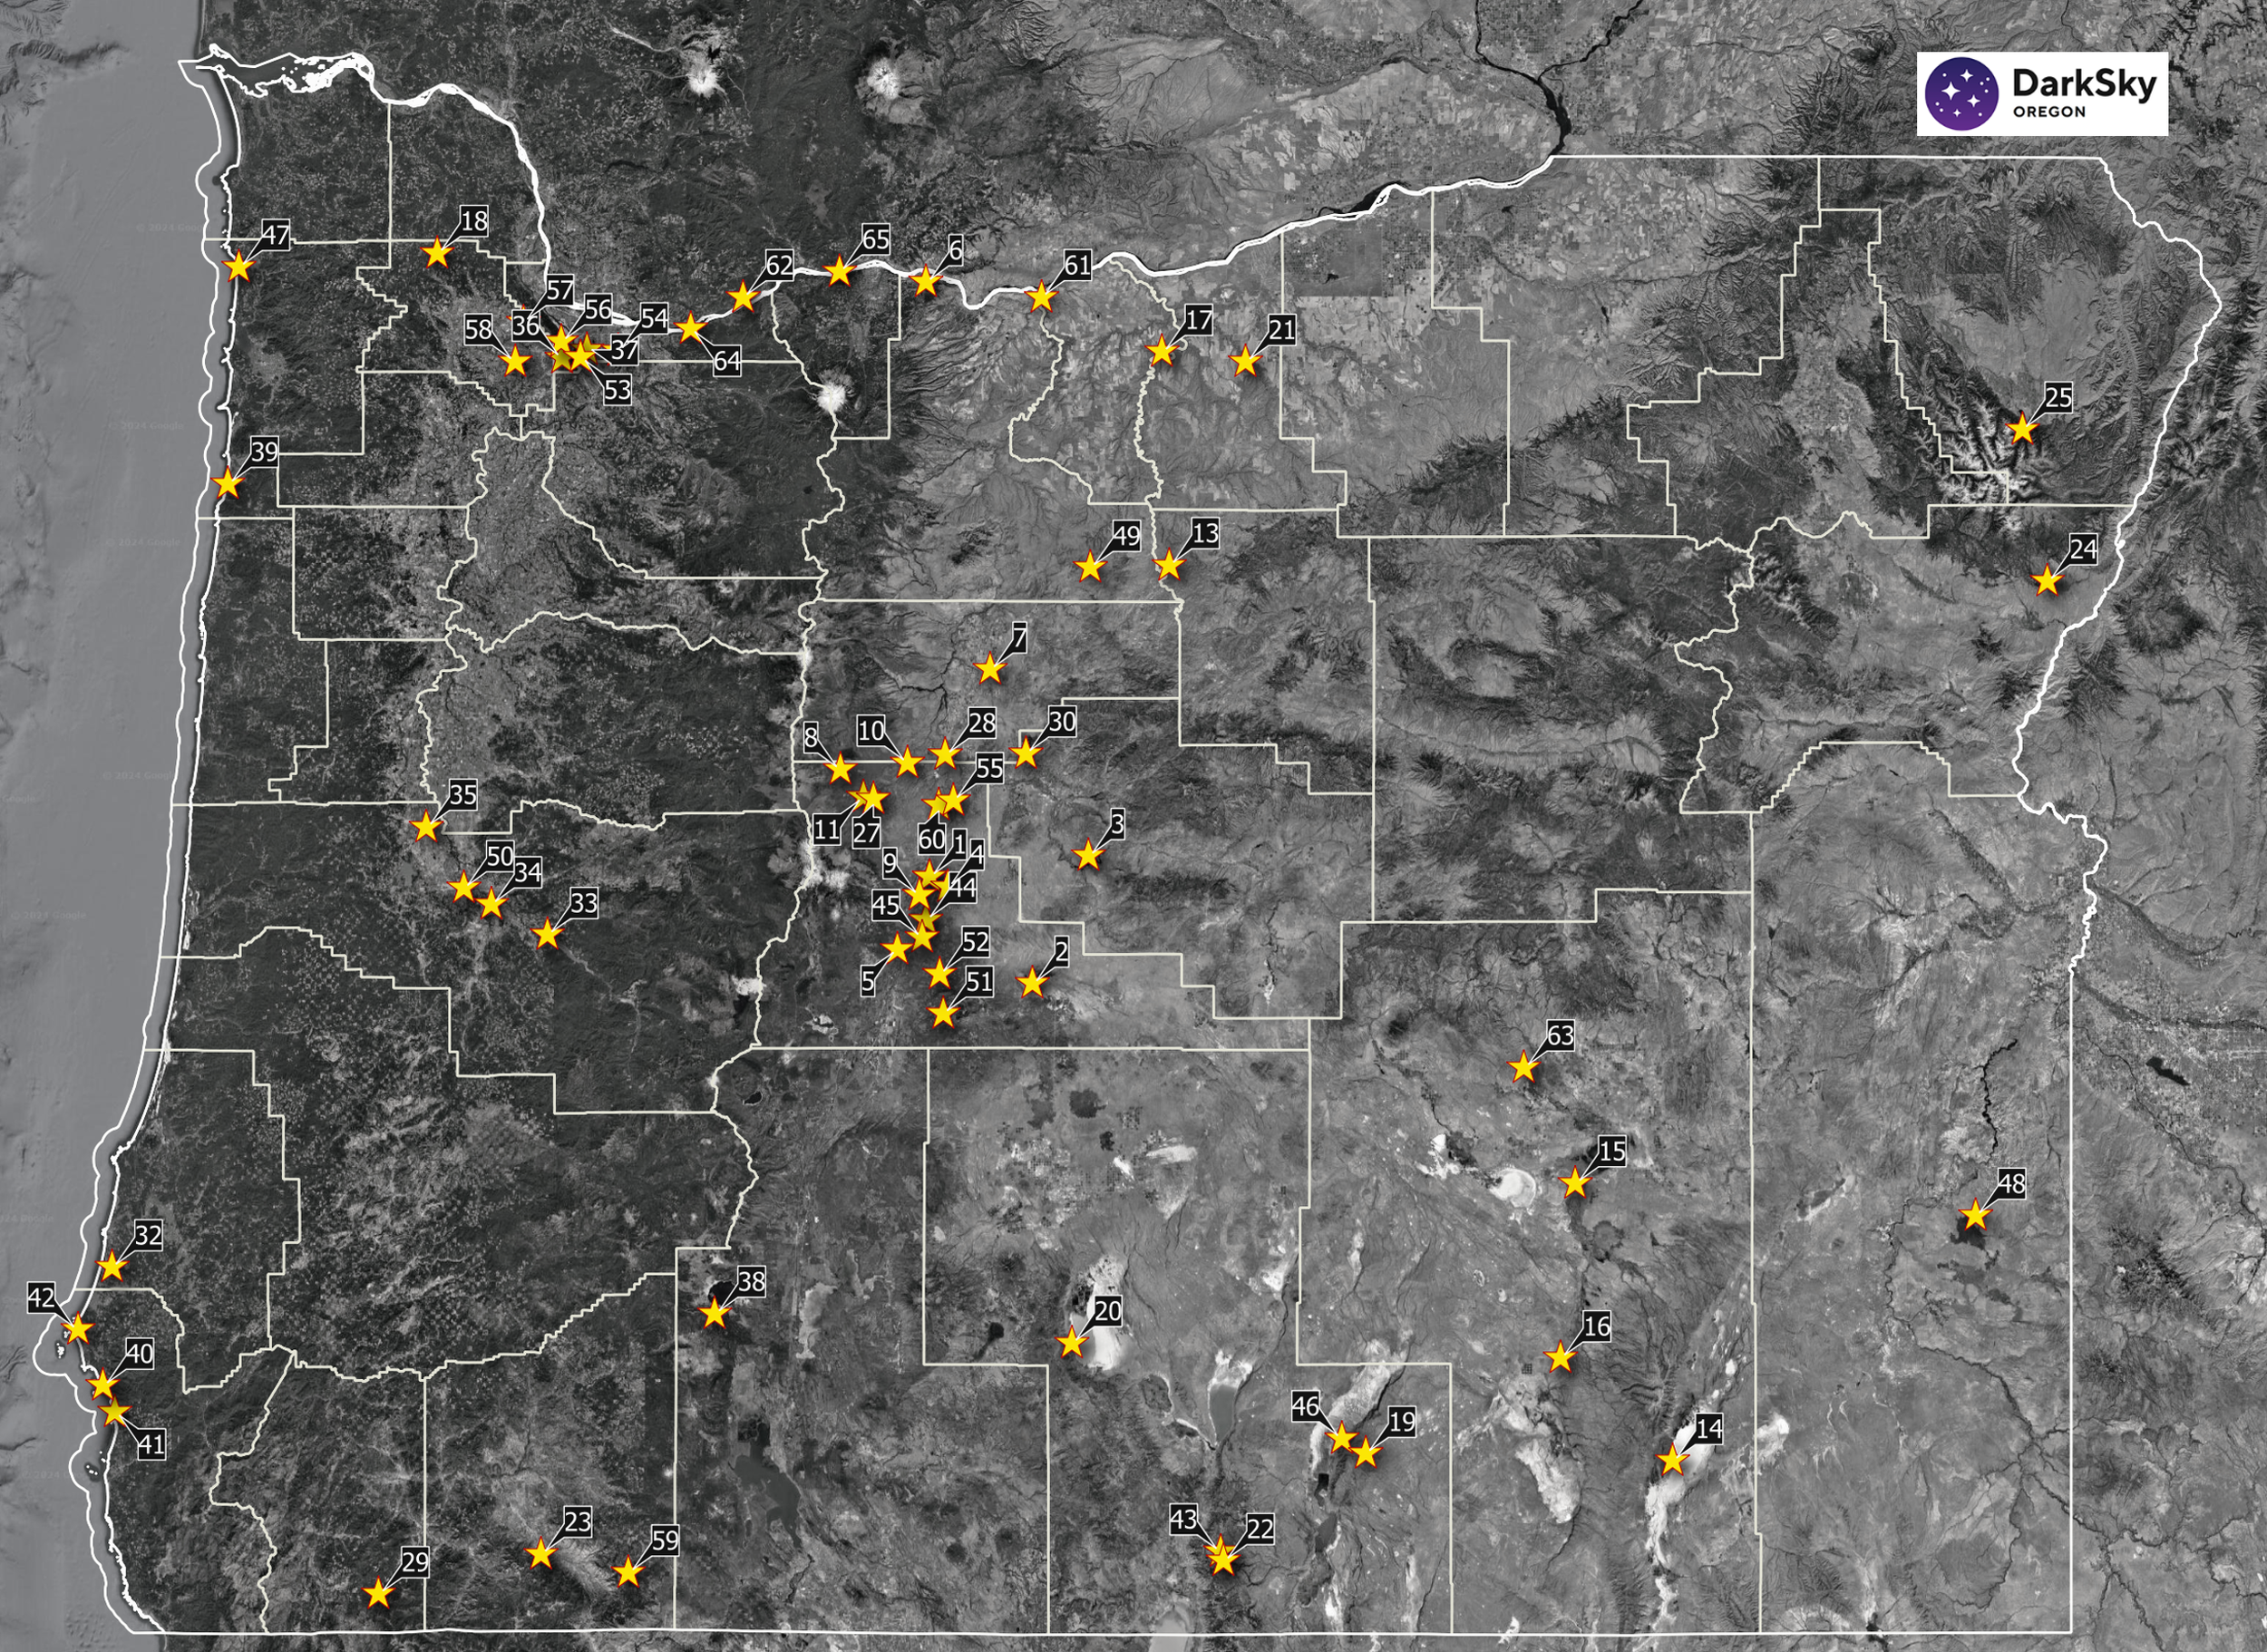
This map of Oregon shows the locations of our Sky Quality Meters as blue circles. Small circles show the least cloudy measurement sites, which are east and south of the Cascade Mountains. Larger blue circles mark sites which are more cloudy at night, mostly along the coast and in the Willamette Valley.

The bar chart below shows the data that was used to size the blue circles in the map. Sites on the left side of the bar chart are least cloudy. Those toward the right side of the bar chart are progressively more cloudy at night.
The chart above shows the percentage of SQM data samples that were recorded at each site under clear (not cloudy) conditions, when the sun was at least 18 degrees below the horizon, and the moon at least 10 degrees below the horizon. The SQM sites that recorded the highest percentage of clear night samples are on the left and sorted toward the right to more cloudy conditions.
Also of interest, the Sky Quality Meter data allow a breakdown of the percentage of clear samples by month of the year, as shown in the next chart. Each bar in the chart below shows the percentage of samples on moonless nights by month, which were cloud free.
For those who enjoy a data heavy read, the table below shows the percentage of clear night SQM data samples by month.
The first data column is color-coded, with the SQM sites that recorded the highest percentage of clear night samples at the top, in green color.
The middle data columns show the distribution of clear night samples across months of the year. All of those data columns are color-coded together, so that the green blocks identify the SQM sites and months during which the highest percentage of clear night data was recorded.
The rightmost column shows the total number of clear night samples recorded to date at each site. This column is color coded to show which sites have limited data to date because they are relatively new - the red blocks. Results for the blocks on the red end of the color scale are likely to change as more data is acquired.
White blocks represent no data acquired at those sites during those months so far.
All samples were recorded on a 5-minute cadence. Samples are considered cloud free if the 45-minute period before and after the sample showed minimal variation in brightness. (See Appendix B of the related Technical Report)
Support the effort to reduce light pollution.
Contact us at: hello@darkskyoregon.org
Key Results from the Oregon SQM Network: